Ethereum outflows have surged to their highest levels since 2022. However, ETH price must reclaim the key weekly EMA level to confirm a potential bottom.

Ethereum’s native token, Ether Ethereum , witnessed its lowest weekly close since November 2023, highlighting just how much the top altcoin has struggled over the past few months.
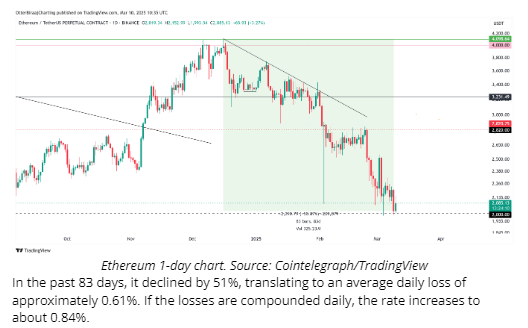
In the past 83 days, it declined by 51%, translating to an average daily loss of approximately 0.61%. If the losses are compounded daily, the rate increases to about 0.84%.
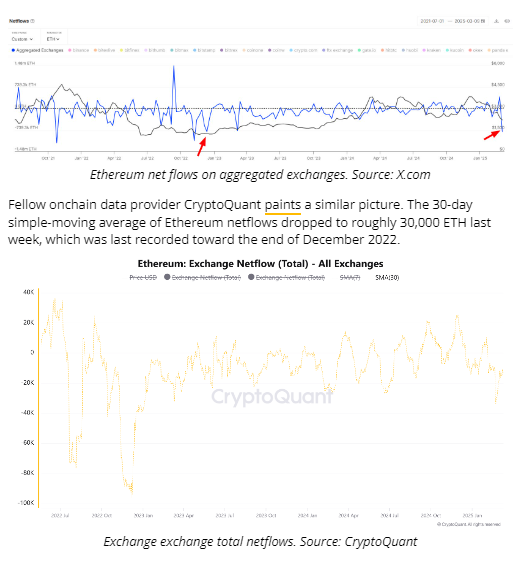
Ethereum exchange outflows hit 27-month high
According to IntoTheBlock, a crypto analytics platform, Ethereum witnessed significant outflows worth $1.8 billion over the past week. It was the highest weekly outflow since December 2022, and in an X post, the platform added,
“Despite ongoing pessimism around Ether prices, this trend suggests many holders see current levels as a strategic buying opportunity.”
Likewise, Ethereum’s MVRV (market value to realized value) ratio dropped to 0.8 for the first time since Oct. 18, 2023, as observed in the chart.
Related: Crypto ETPs see 4th straight week of outflows, totaling $876M — CoinShares
The MVRV ratio is a metric that calculates ETH’s market price to the average price at which all ETH in circulation was last moved.
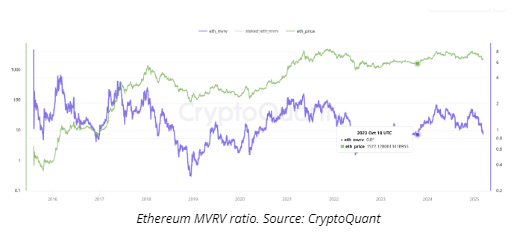
An MVRV ratio below 1 indicates undervaluation, signaling a potential buying opportunity. For context, when the MVRV ratio dropped to 0.8 on Oct. 18, 2023, Ether registered a local bottom near $1,600, followed by a bullish reversal and the beginning of the 2024 bull run.
Is the Ethereum bottom in?
Ether price is currently consolidating near its psychological level at $2,000, following a steady correction since the beginning of 2025.
With respect to this intraday price action, Mikybull, a technical analyst, points out that Ethereum is “showing a bullish reversal” with a diamond price pattern.
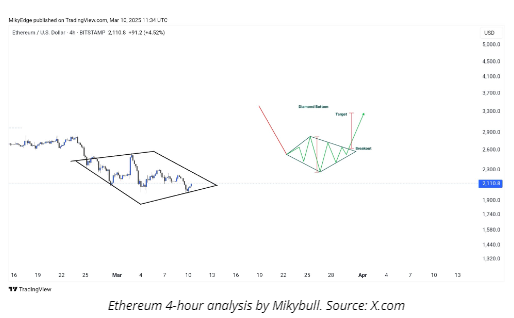
A diamond pattern after a downtrend suggests a potential bullish reversal. Based on this pattern’s measured target, Ether could rebound about 20% to $2,600 from its current price.
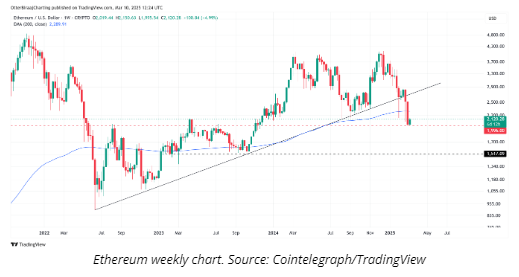
On the flip side, Ether’s weekly chart closed below the 200-day EMA level for the first time since October 2023. Since 2020, ETH price has remained under this indicator for less than 15% of the time. Previously, Ether rebounded in the following week every time it dropped below this trendline in 2023.
Related: Bitcoin ‘Monte Carlo’ model forecasts $713K peak in 6 months
However, a prolonged period under this line may extend ETH’s bottom price target. Thus, it will be critical for Ethereum to bounce back above this EMA trendline to confirm the bottom over the next few days or weeks.