ETH price charts confirmed a triangle breakdown, shifting the near-term bias lower and putting $2,250 in focus if sellers stay in control.

Ether
is now more than 14% below its local peak near $3,400, underscoring the sellers’ tenacity above $3,000. A bearish technical setup suggests the pressure may extend into February.
Key takeaways:
ETH fell back below $3,000, confirming a triangle breakdown that targets $2,250.
The bearish scenario can be avoided if ETH breaks above a multimonth moving average resistance.
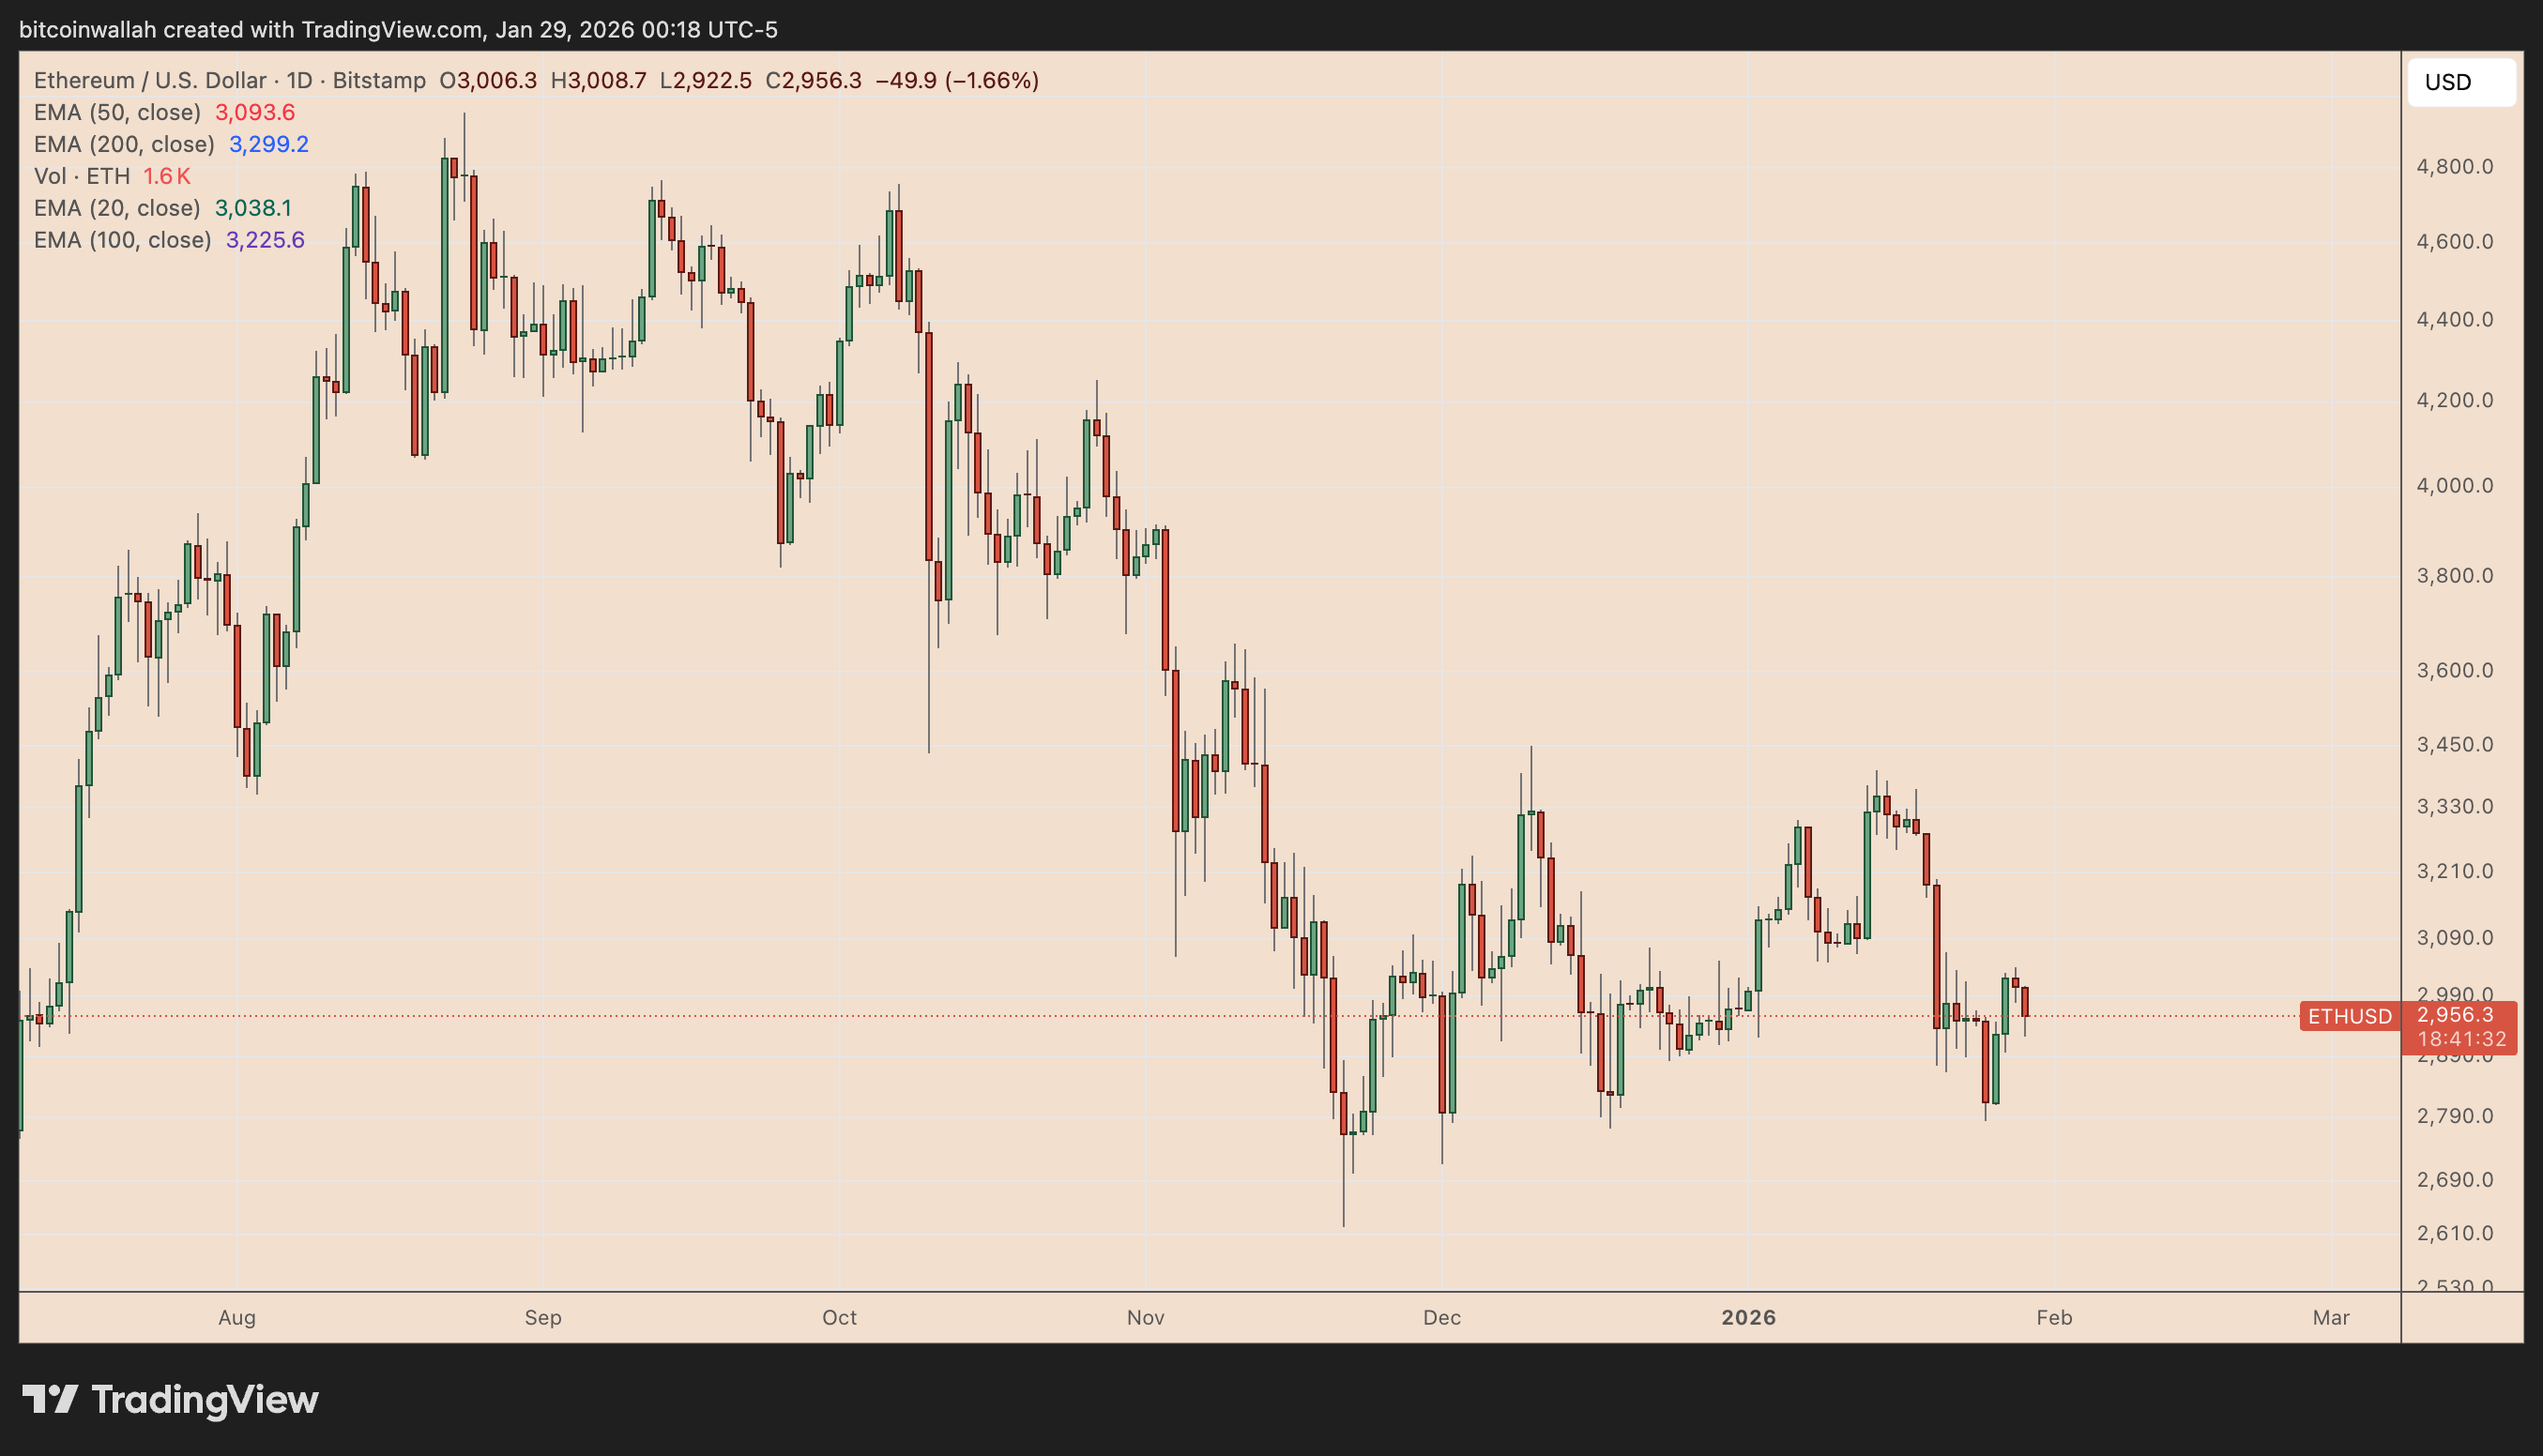
ETH/USD daily chart. Source: TradingView
Ether in textbook symmetrical triangle breakdown
On Thursday, ETH fell about 2.85% to around $2,920 after the Federal Reserve held rates steady at its first policy meeting of the year, with rising Iran-related geopolitical tensions adding to the risk-off mood.
The latest drop has put Ether into the breakdown phase of its symmetrical triangle setup.
ETH dropped below the pattern’s lower trendline last week, then rebounded to test that former support as resistance. The retest failed, and the price stayed capped beneath the trendline into this week.
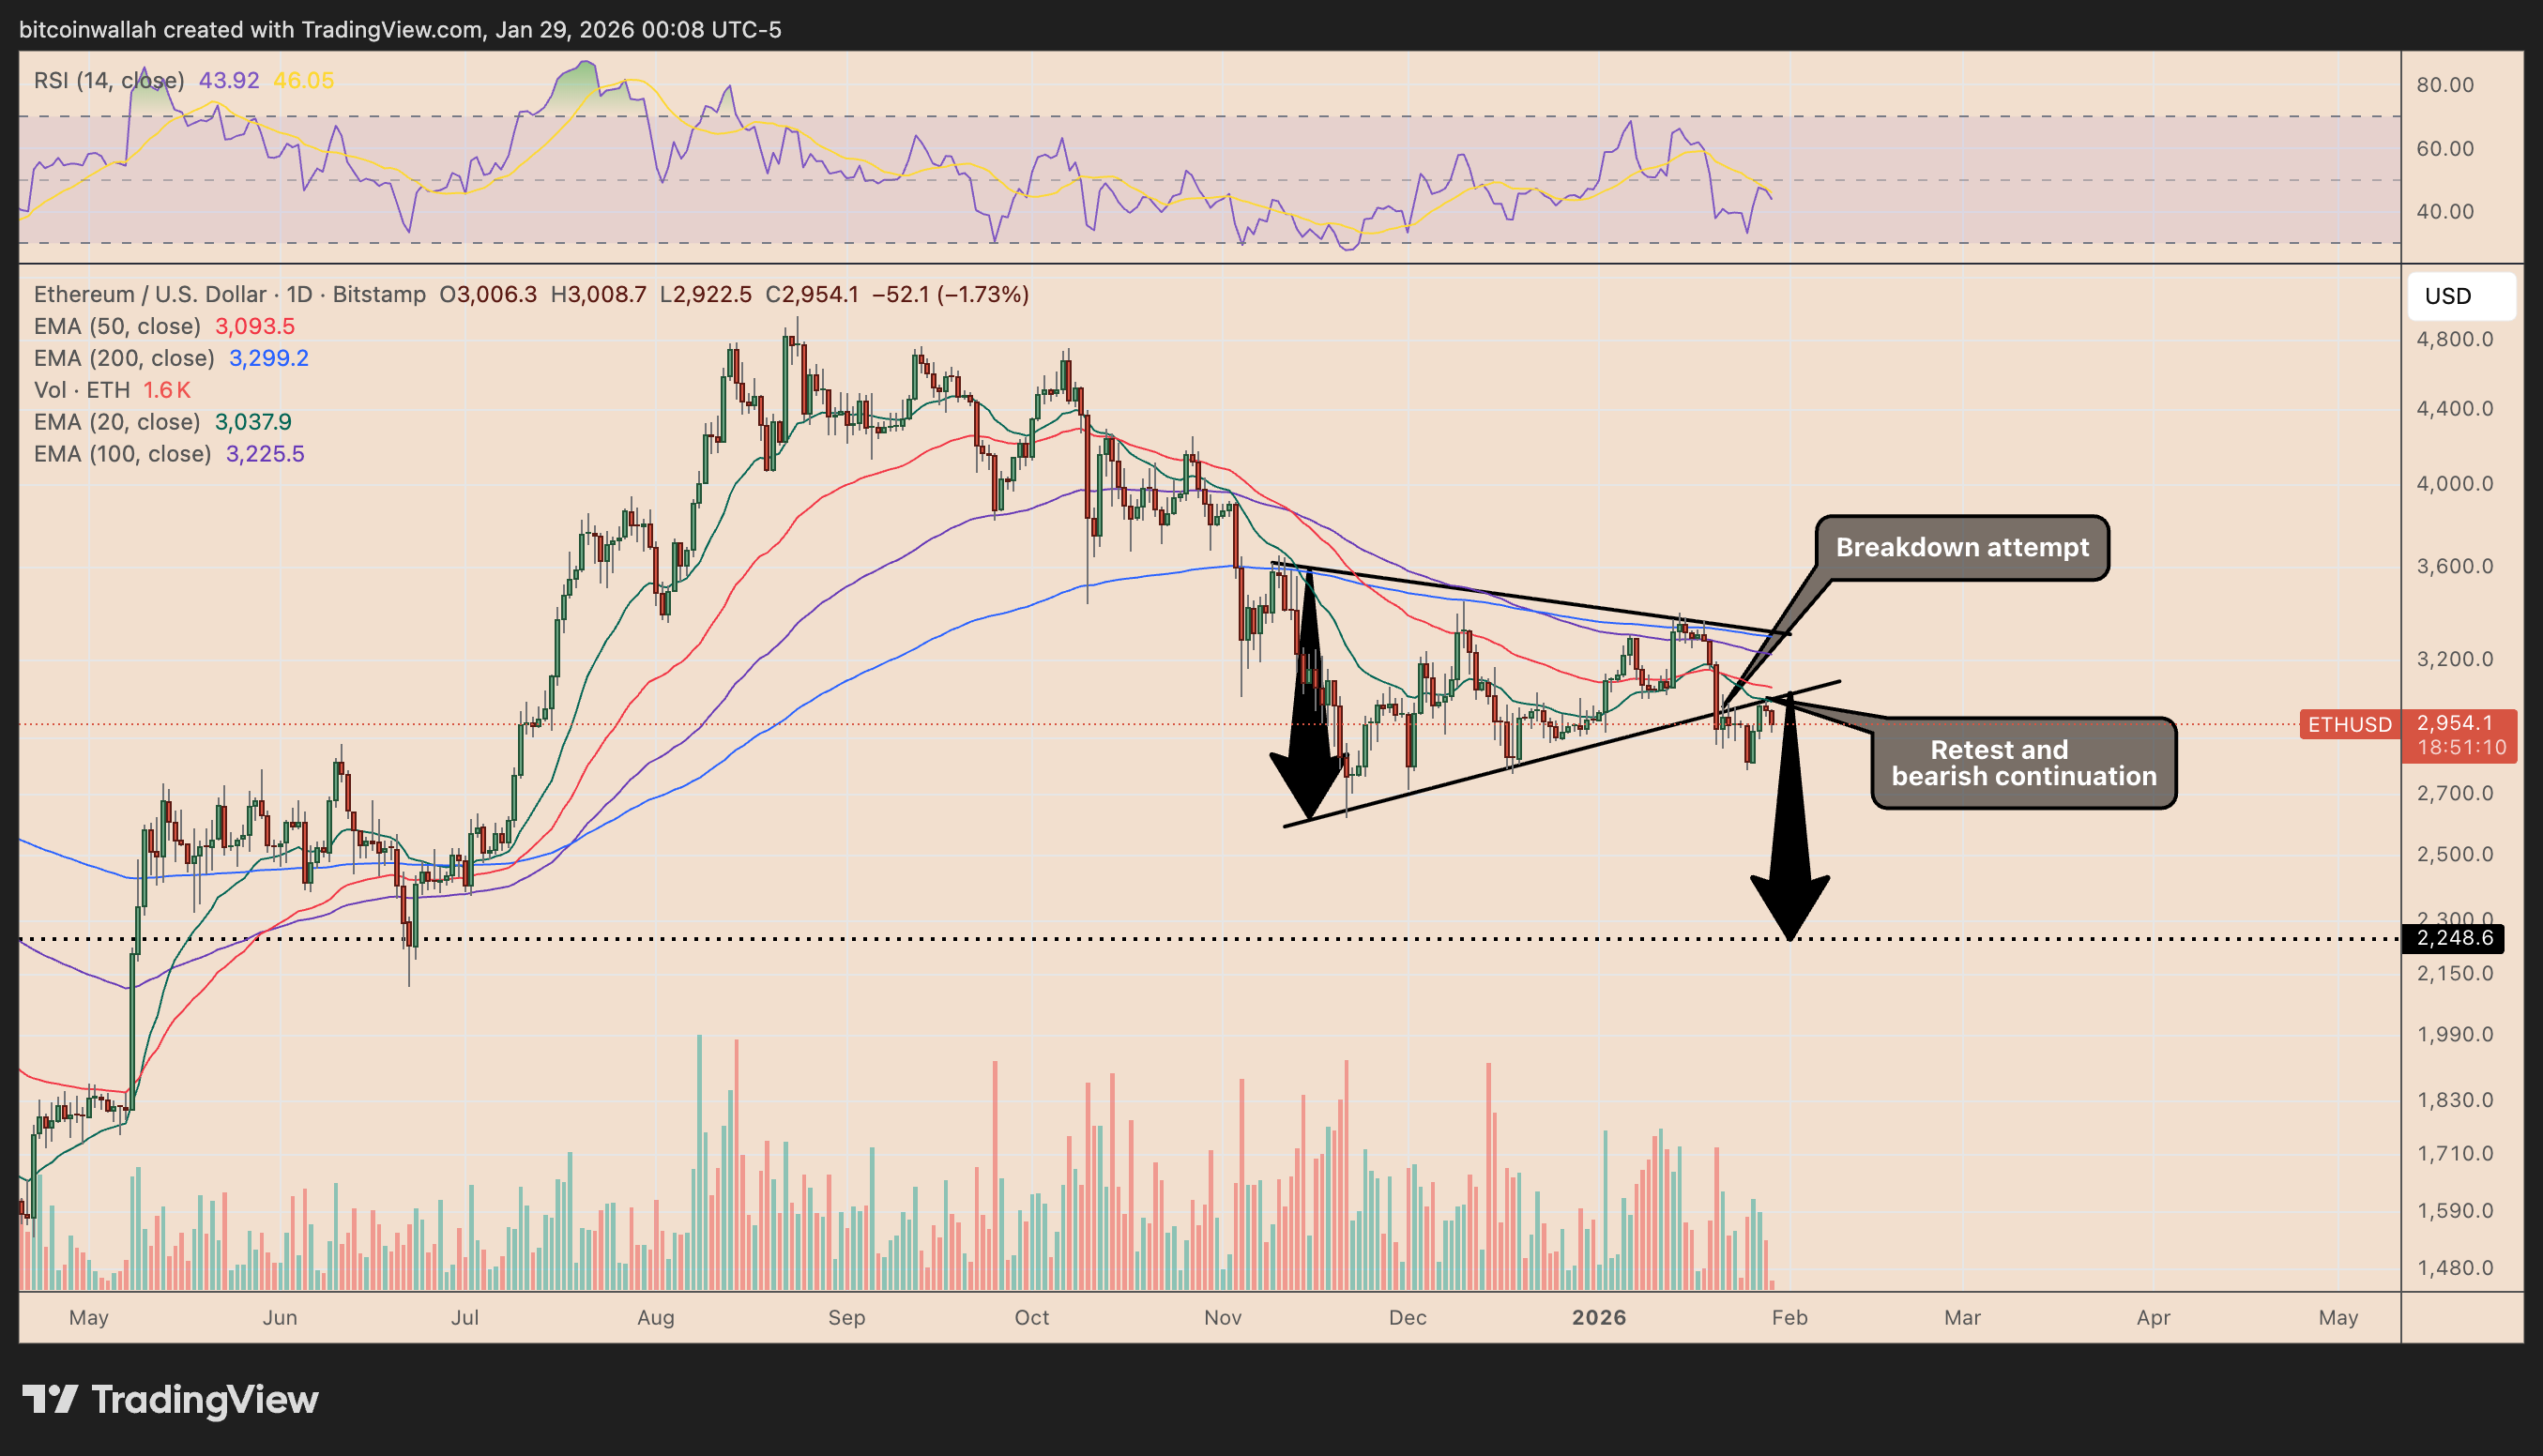
ETH/USD daily chart. Source: TradingView
In technical analysis, a break below support followed by a rebound and rejection often signals that sellers have flipped the level into resistance, raising the odds of further downside.
ETH’s price could decline toward the measured target near $2,250, a decrease of approximately 25%, by mid-February if the breakdown continues.
Can Ethereum bulls avoid the crash?
This bearish outlook could be invalidated if ETH flips the triangle’s lower trendline back into support.
Bulls would then need follow-through above the 200-3D EMA near $3,065 (blue) and, more importantly, the 50-3D EMA (red), which has capped every upside attempt above $3,000 since November 2025.
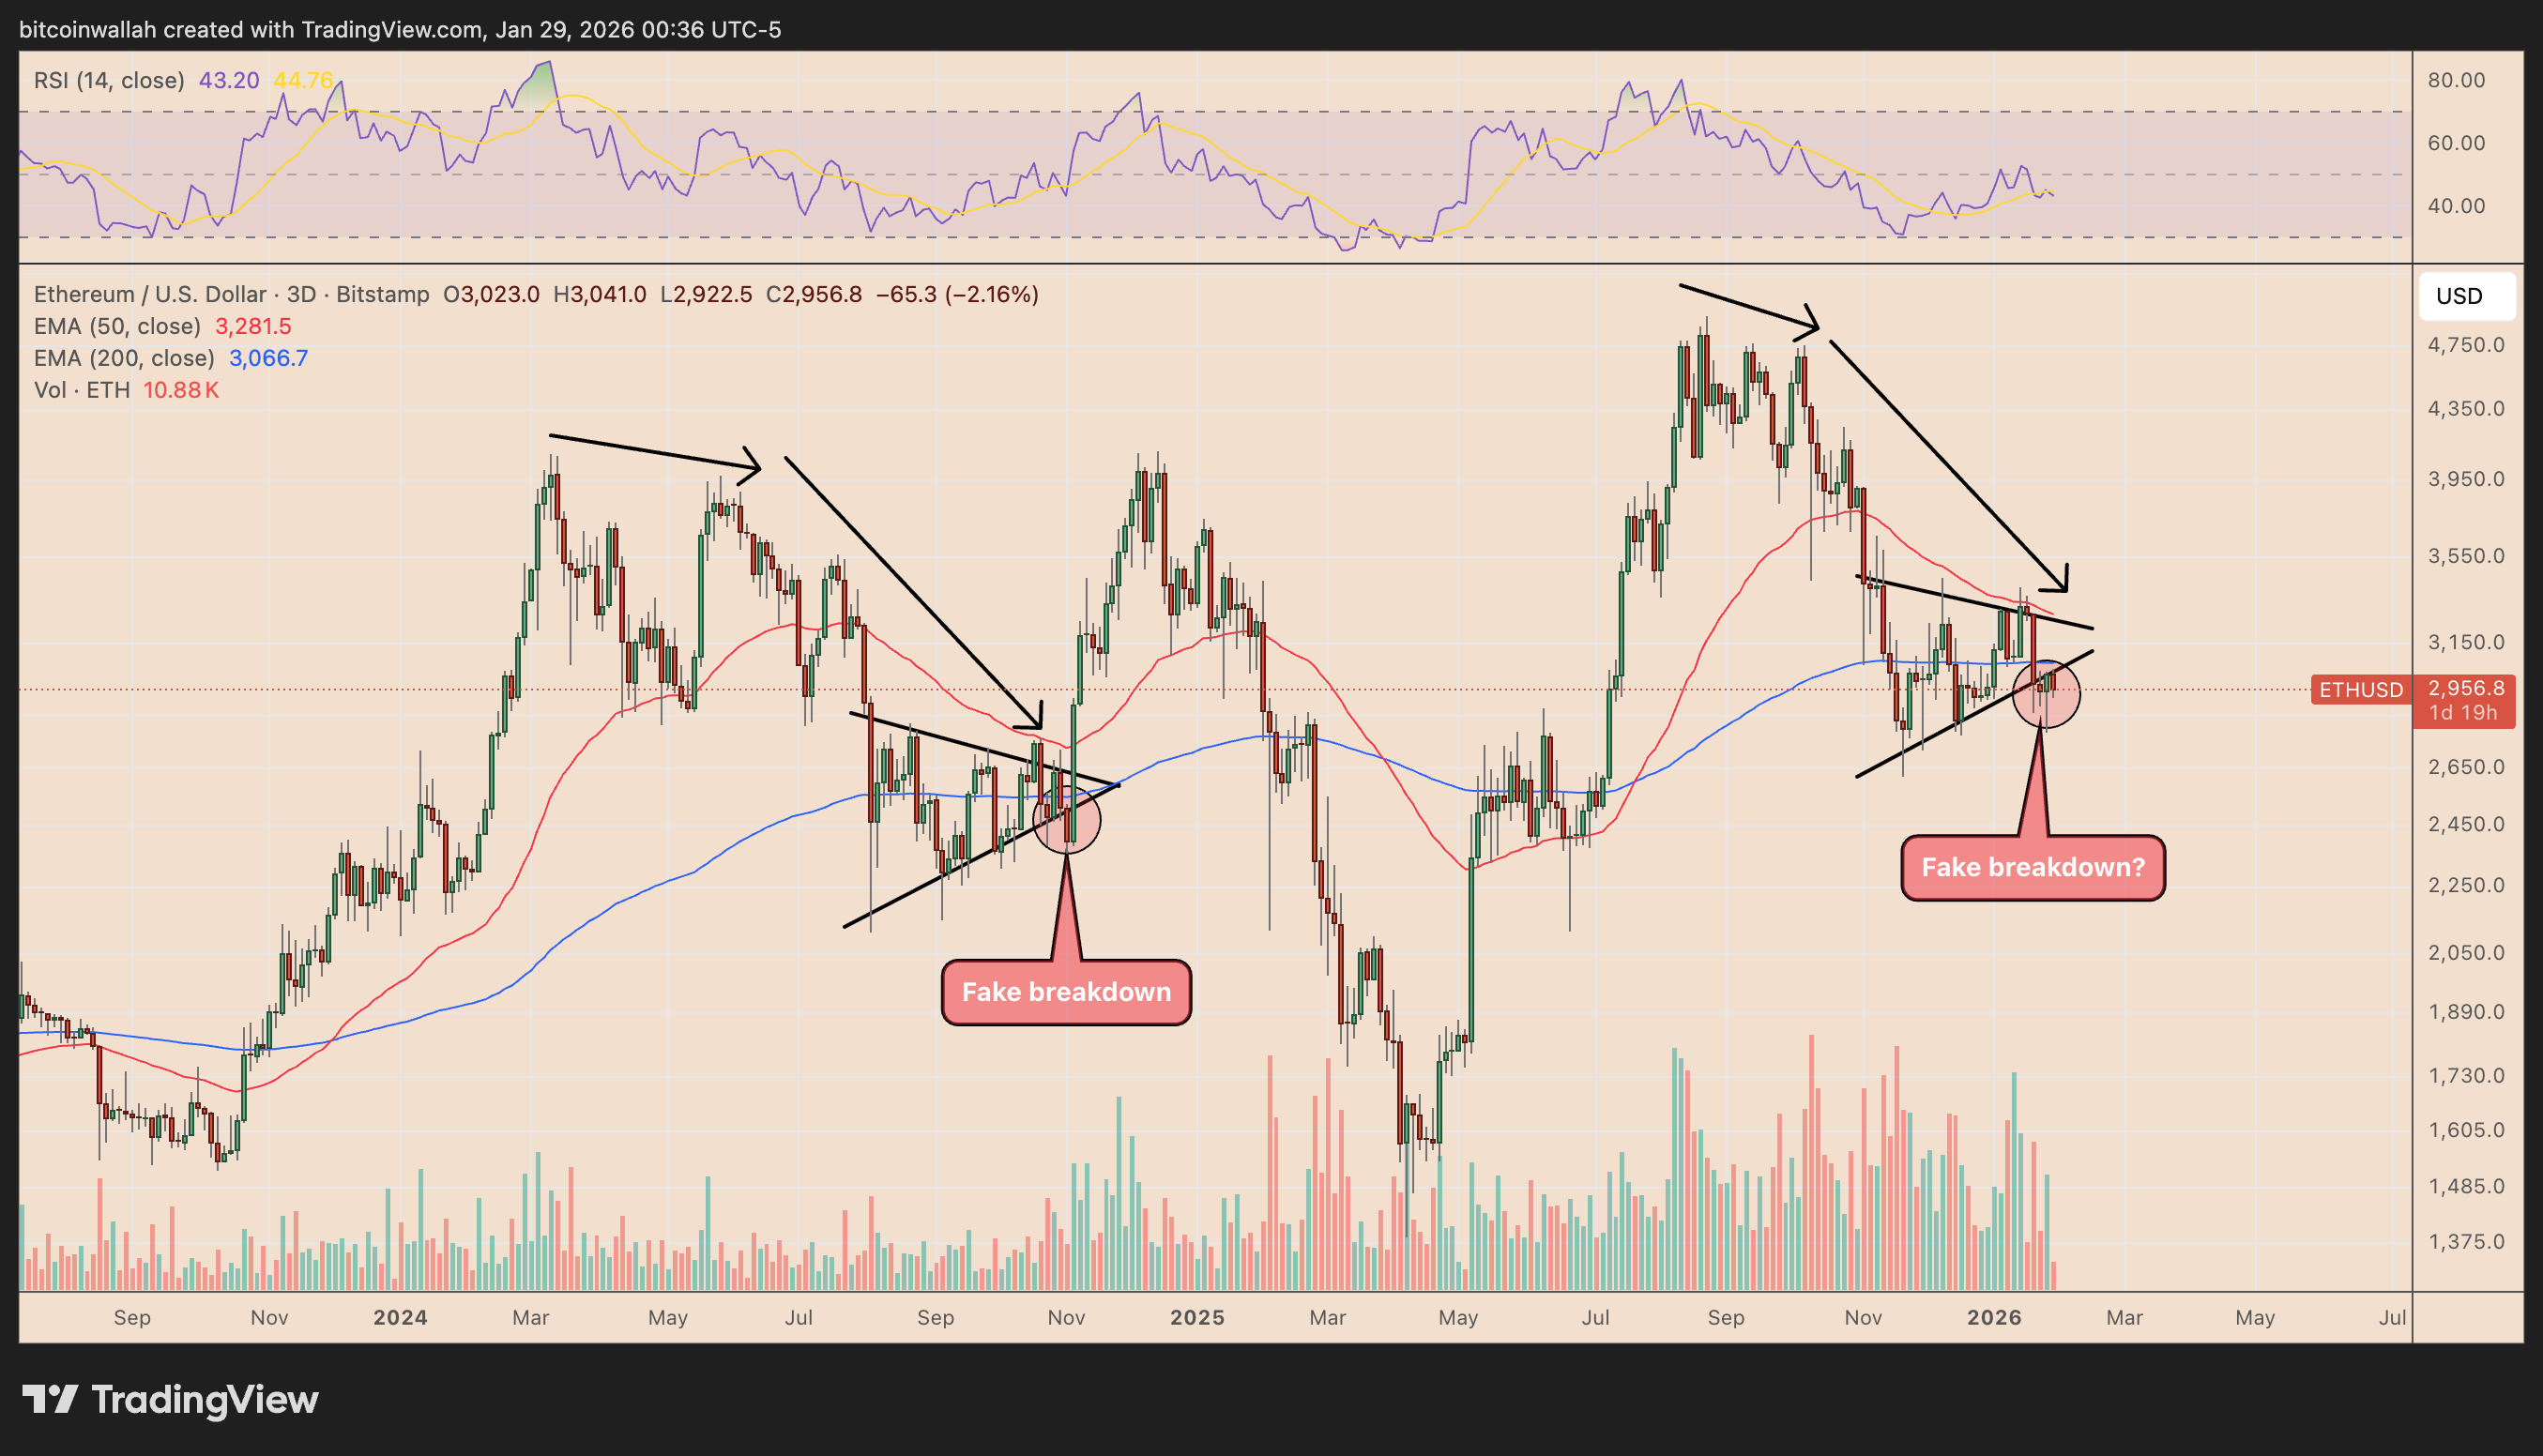
ETH/USD three-day chart. Source: TradingView
A clean reclaim of those levels would signal that the breakdown failed.
That setup would echo the 2024 fractal, when ETH briefly broke down from a similar structure before reversing higher once it reclaimed its key moving averages.
Related: Crypto market weakness persists, but Ethereum metrics hint at rally to $3.3K
It would further align with numerous bullish Ether predictions of a record high in 2026. That includes crypto analyst Annie’s prediction of a $10,000 ETH price led by a bullish Wyckoff accumulation model.
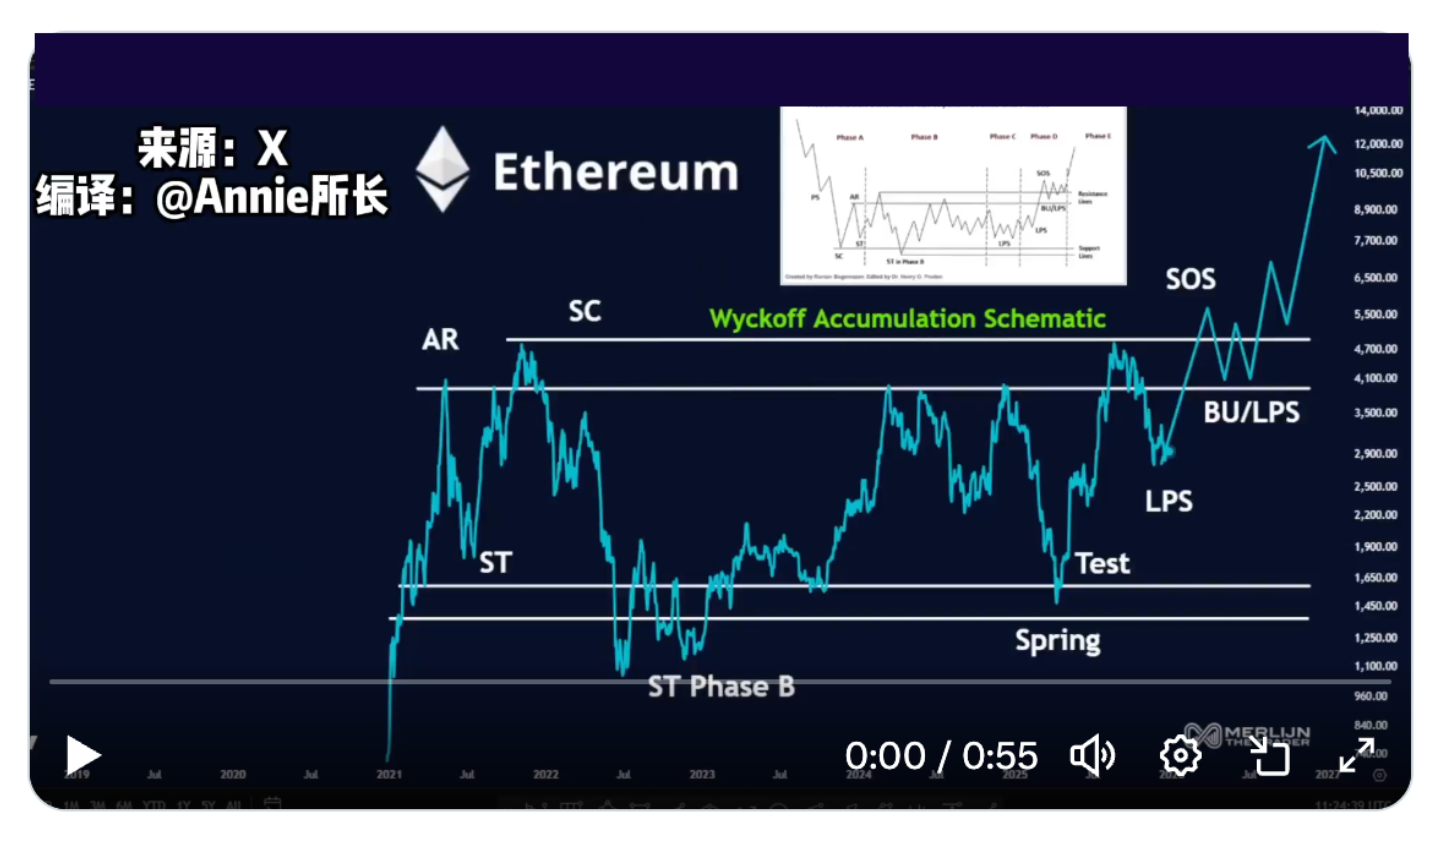
Ethereum price chart ft. Wyckoff accumulation schematic. Source: Annie
Standard Chartered forecasted ETH’s price to hit $7,500 in the same period.