Key Highlights
ETH price declined to a new low below the $360 level before finding buyers against the US Dollar.
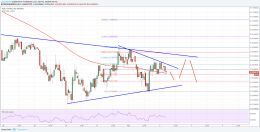
There is a key connecting bearish trend line forming with resistance at $385 on the hourly chart of ETH/USD (data feed via Kraken).
The pair may move above the $385-390 resistance zone for a short-term upside correction.
Ethereum price is facing heavy selling pressure against the US Dollar and Bitcoin. ETH/USD may correct higher in the near term towards the $400-410 resistance zone.
Ethereum Price Resistance
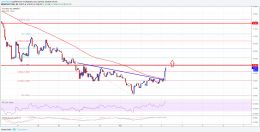
There was no respite for buyers as ETH price declined below the $380 and $360 support levels against the US Dollar. The price traded to a new low around the $355 level before starting an upside correction. It moved above the 23.6% Fib retracement level of the last downside move from the $419 high to $360 low. However, there are many barriers on the upside near the $385 and $390 levels.
At the moment, the price is trading just below the 50% Fib retracement level of the last downside move from the $419 high to $360 low. There is also a key connecting bearish trend line forming with resistance at $385 on the hourly chart of ETH/USD. The pair may soon break the trend line resistance to start an upside move above $390. The next hurdle could be around the $400 level and the 100 hourly simple moving average. A proper close above the $400 level may ignite further gains in the near term.

On the flip side, if the price fails to move above the $385 level, there could be a downside move back towards $360. A break below $360 could even push the price below the $350 level. Below $350, the price remains at a risk of a sharp downside wave.
Hourly MACD – The MACD is slightly in the bullish zone.
Hourly RSI – The RSI is currently just above the 50 level.
Major Support Level – $360
Major Resistance Level – $400