Ether is consolidating losses against the US dollar and bitcoin. ETH/USD struggled to pierce $620.00 and is currently trading in a range.
Key Highlights
Ether’s price is correcting higher but it is struggling to trade above $620.00 against the US dollar.
There is a key contracting triangle forming with resistance near $625.00 on the hourly chart ETH/USD.
ETH/BTC found support near 0.0720BTC and it started correcting higher.
Technically, the 4-hour chart indicators are well below midlines with bearish signs.ETH/USD Facing Key Hurdles
Yesterday, we discussed why a break above $620.00 is important for ETH/USD to trade back toward $650.00. The pair made an attempt to surpass $620.00, but it failed to overcome selling pressure.On the other hand, ETH/BTC found bids near the 0.0720BTC support. The pair is currently moving higher and it may perhaps trade toward the 0.0750BTC in the near term.
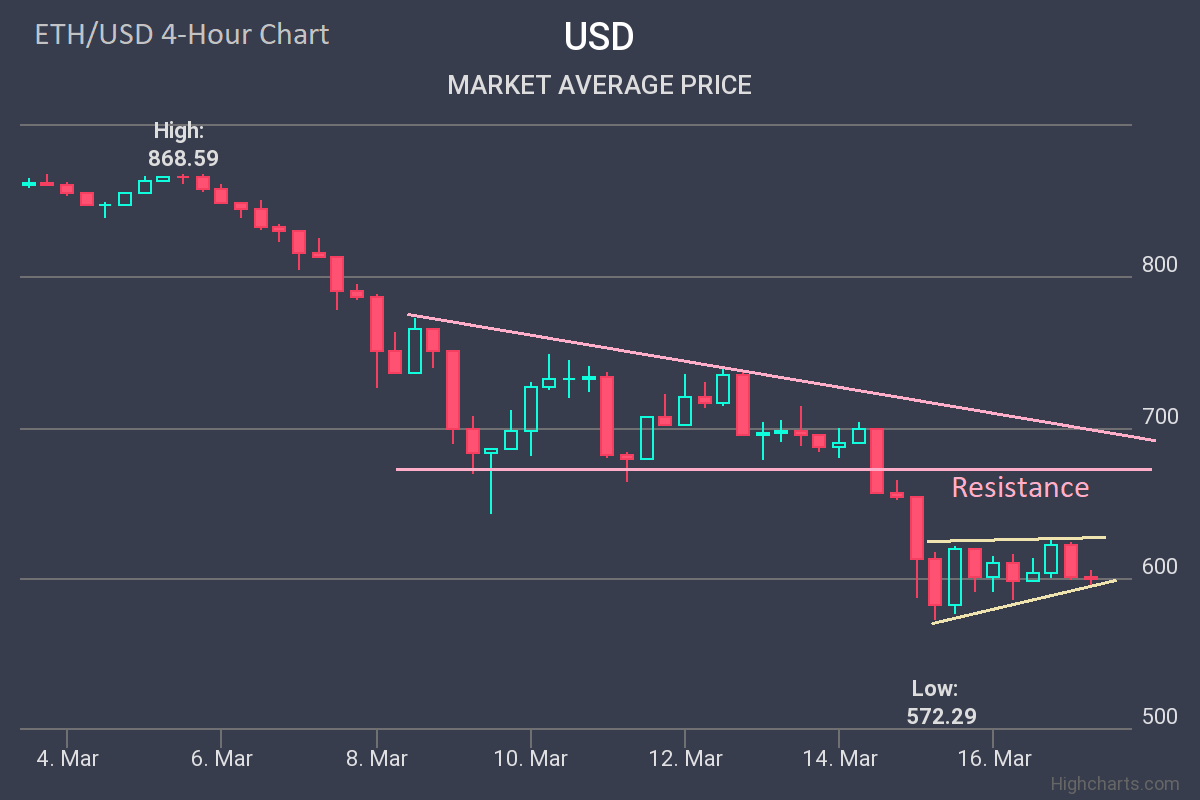
The 4-hour chart of ETH/USD suggests that the last decline was crucial, as the pair settled below a key support at $675.00. The pair later found support around $572.00 and started consolidating losses.There is a short-term breakout pattern forming on the same chart with resistance near $620.00. The current trend is still bearish and there is a risk of more declines if Ether’s price fails to stay above the $590.00 and $575.00 support levels.On the upside, the broken support at $575.00 and a bearish trendline with resistance at $690.00 will most likely prevent an upward move. Moreover, the 23.6 percent Fibonacci retracement level of the last major fall from the $868.59 high to $572.29 low is also a key barrier.
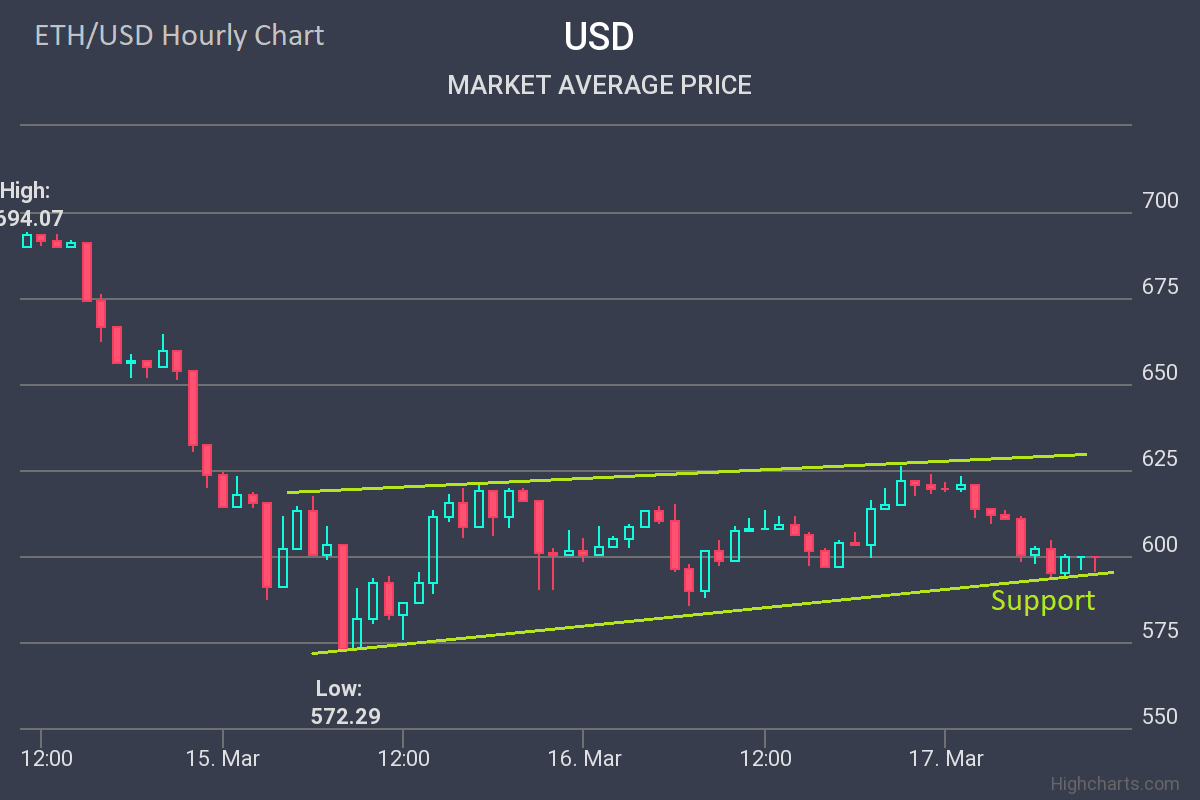
Moving on to the hourly chart of ETH/USD, there is a major contracting triangle forming with resistance near $625.00. The pair must move above the $620.00 and $625.00 resistance levels to recover further.On the downside, the triangle support is at $590.00. An hourly close below $590.00 could push the price toward $575.00, which then must hold declines to contain further losses. The technical structure is currently bearish to neutral on the hourly chart as long as the price remains above $590.00.
Important Resistance Levels
$620.00 and $650.00
Important Support Levels
$590.00 and $575.00
Hourly RSI
The RSI is currently near 35 with no major sign of an upward move.
Hourly MACD
The MACD is struggling to move back in the bullish zone.