Key Highlights
· ADA price struggled to recover and is currently trading well below the $0.2000 level against the US Dollar (tethered).
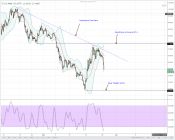
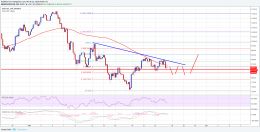
· There are two key bearish trend lines forming with resistance at $0.1900 on the hourly chart of the ADA/USD pair (data feed via Bittrex).
· The pair is still above the $0.1800 support level, but it is in a bearish zone with the next support at $0.1680.
Cardano price is struggling to correct higher against the US Dollar and Bitcoin. ADA/USD must stay above the $0.1800 support to avoid further declines in the near term.
Cardano Price Decline
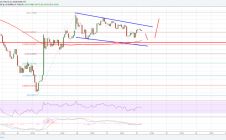
There was a short-term correction initiated from the $0.1810-00 support area in ADA price against the US Dollar. The price corrected higher, but it could not break above the $0.2000 resistance. Moreover, the price struggled to break the 100 hourly simple moving average at $0.2018. As a result, there was a downside push and the price moved back towards the $0.1800 level.
At the moment, the price is holding the $0.1800 support, but it remains at a risk of more losses. On the upside, an initial resistance is around the 23.6% Fib retracement level of the last decline from the $0.2018 high to $0.1797 low. Moreover, there are two key bearish trend lines forming with resistance at $0.1900 on the hourly chart of the ADA/USD pair. The trend line resistance is also close to the 38.2% Fib retracement level of the last decline from the $0.2018 high to $0.1797 low. More importantly, the $0.1850 zone is near the 100 hourly simple moving average.
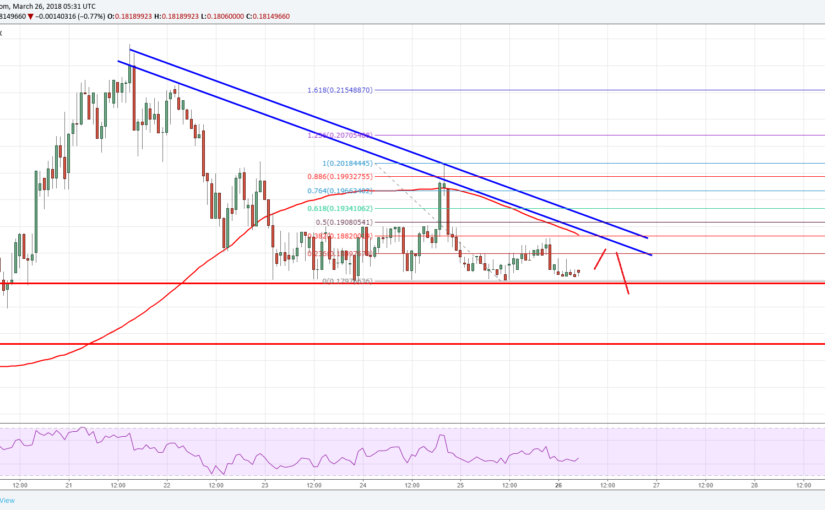
Therefore, an upside recovery above $0.1850-0.1900 won’t be easy. On the downside, a break and close below $0.1800 will most likely push the price towards the next support at $0.1680.
Hourly MACD – The MACD for ADA/USD is currently in the bearish zone.
Hourly RSI – The RSI for ADA/USD is now well below the 50 level.
Major Support Level – $0.1800
Major Resistance Level – $0.1900

